- Have any questions?
- +86 15953537010
- admin@wepower-electronic.com


A lighter stream comes on line. The density trace starts to fall. Someone watching the blend limit asks whether the oil itself got lighter. Maybe. The line temperature moved too, and a live kg/m³ figure cannot sort those causes out by itself. The lab may report the same crude in API degrees. That is not a second density unit; it is an oil-to-water comparison on a reference basis. Higher API means lighter oil. Put the stream values on the same temperature basis before deciding what the blend did. And do not average API degrees as if they were percentages.
What Does API Gravity Tell You About Density?
The screen displayed, 850 kg/m³ is the same density as 0.850 g/cm³. That unit conversion is easy. Put 30°C beside one figure and 60°F beside the other, though, they are not ready to compare.
API adds another step. Water is the yardstick: compare it with the oil at the same temperature, then run that ratio through the petroleum scale. The U.S. Energy Information Administration gives the equation in its API gravity definition:
°API = (141.5 / specific gravity at 60°F/60°F) − 131.5
That scale runs in reverse. A 35° API stream is less dense than a 20° API stream when both use the same reference condition. On a screen where one field says “Density” and another says “API,” it is easy to miss. Write down the unit and temperature. Mark the density value raw or corrected. Six decimal places will not supply the missing basis.
The label matters at handover. If a lab number goes into the control sheet while the line temperature stays on another screen, the context can get lost. Put both values in the same trend. It is a small detail until the blend limit is close.
Where Does Density Enter the API Gravity Calculation?
When 60°F: water ≈ 999 kg/m³. Reference oil density = 850 kg/m³; SG (oil/water) ≈ 0.8509. Back through the EIA equation, that ratio lands around 34.8° API.
That same “850” at 30°C is a different thing. Do not divide the warm line value by water density at 60°F. A calculator will not complain; the reference basis should.
The display should say what it means: live or corrected. If the tag offers only “Density,” look at the configuration before matching it to a lab result. The missing word matters more than another decimal place.
Can a Warmer Line Shift Density and API Gravity?
Heating a stream gives the same mass more room in the pipe, so the density reading drops. That can happen without a change in the crude. A 30°C line value and a lab result corrected to 60°F will not match line for line.
Picture the handover: the incoming operator sees today’s live line value beside a lab result from hours earlier. There is a gap. Before touching the blend ratio, check the temperature and reference basis beside each number.
When a live reading has to match a reference value, temperature correction in density measurement belongs in the comparison. The EIA equation uses 60°F/60°F specific gravity. A contract may name another basis for a separate reported value; keep it with that number.
The same dip can come from more light feed or a hotter line. If both changed during the shift, one density trace cannot tell you which caused it. Put temperature and blend ratio on the same screen before changing the target.
Why Shouldn’t You Average API Gravity?
API degrees are not spaced evenly with density. Averaging two API numbers does not give the same blend as averaging their specific gravities. Convert the streams first:
Specific gravity = 141.5 / (°API + 131.5)
| Stream | API Gravity | Specific Gravity |
| Heavier stream | 20° | 0.934 |
| Lighter stream | 50° | 0.780 |
| Equal-volume blend | about 33.6° | 0.857 |
Half of each stream gives SG 0.857; converted back through the API equation, that is about 33.6°.
This shortcut API calculation gives 35 °API. Using an example cutoff of 34 °API, the blend lands on the other side compared to the 33.6 °API reading. The 1.4 °API gap comes from the selected inputs. If you change the feed streams or their blend ratios, this gap will shift.
Example: temperature basis fixed at 60°F; volumes assumed additive.
What Can a Live Density Reading Tell You?
An inline meter follows the blend as it moves. While the lab sample is on its way, that live signal gives you density at the sensor. It becomes API only when the measurement system applies a defined temperature correction and formula.
Keep both values visible. A heater can pull raw density down. The corrected value should steady if composition has not changed; a feed change can move it too. One trace puts the other in context.
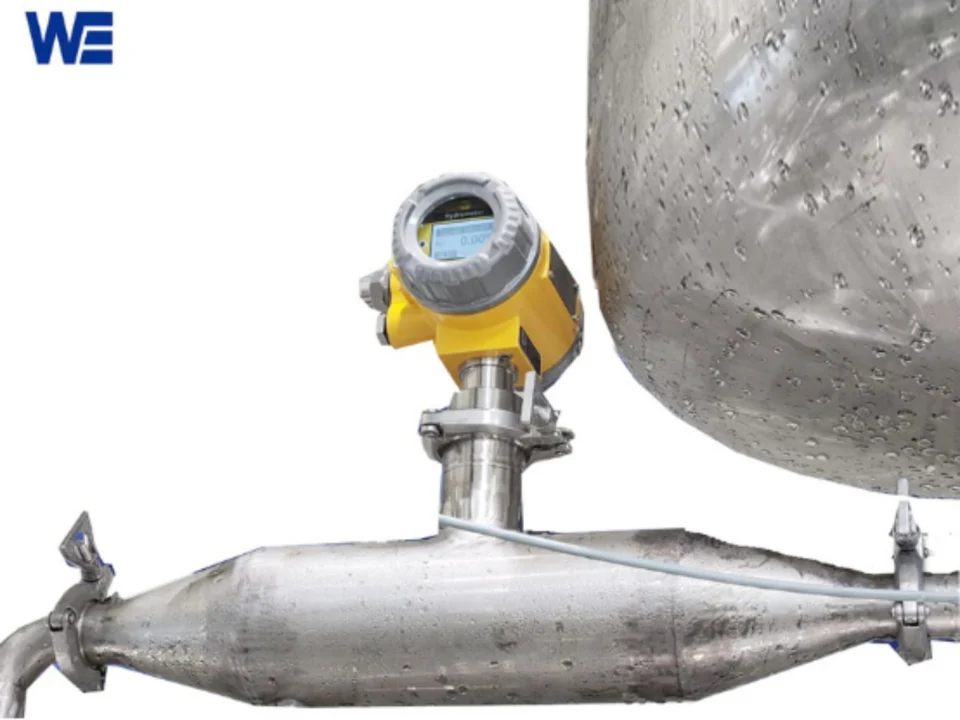
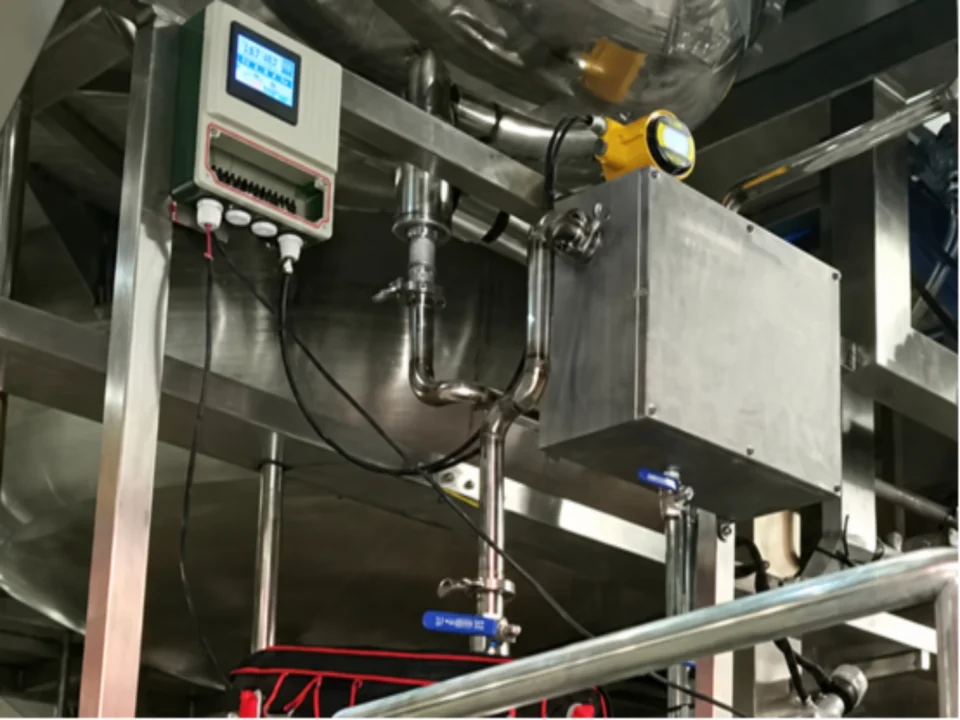
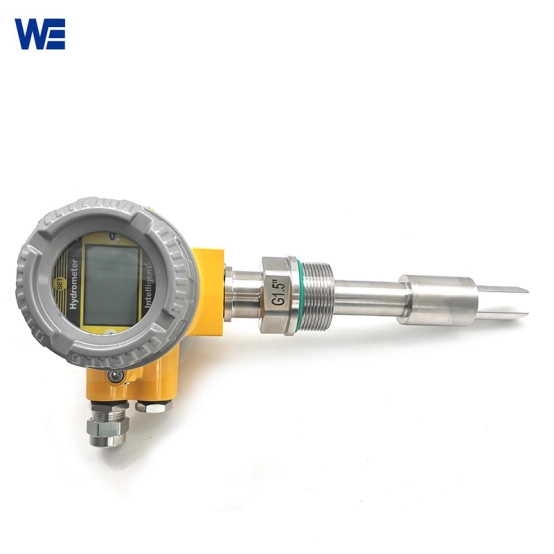
An online density and concentration meter can supply the live liquid signal. If the recipe also depends on how much of each stream passes the meter, mass-flow and density measurement pairs density with mass flow and volume flow, with temperature in view.
Plot both readings on the same trend during a trial blend. When the heater cycles, does raw density dip while the corrected trace stays flat? If the feed ratio moves and both traces follow, look at the blend. The pair helps separate what the sensor detected from what may have changed in the measuring & calculating process.
Need to Compare a Density Reading with an API Limit?
If a line signal has to match an API limit, send us the measurement conditions. Tell us which stream you are measuring. Add the sensor location and line temperature. Include the exact display label. We can then see whether both values share a basis.
FAQ
Does API Gravity Give You Specific Gravity?
Not quite. Specific gravity is the comparison between oil and water at the same temperature. API degrees are calculated from it.
Why Use 60°F for API Gravity?
60°F is the reference used in the EIA equation for both liquids. If a spec calls for another basis, write it beside that result.
Does Higher API Mean a Heavier Crude?
Conversely, at the same reference temperature, higher API value corresponds to lower oil density. A higher API number does not indicate a heavier crude oil.