- Have any questions?
- +86 15953537010
- admin@wepower-electronic.com

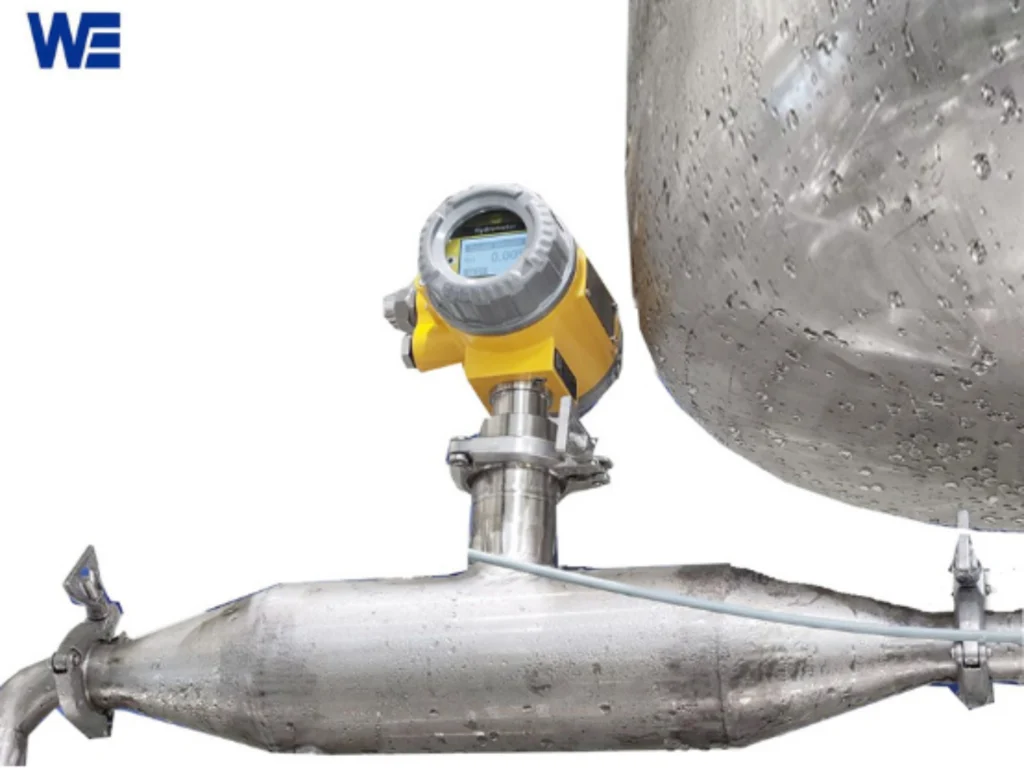
Are processes in the fermentation department still in the change phase or has a stable process phase been reached? Trend information from density measurement can be very useful for fermentation teams. In the production of beer, wine and other fermented beverages the content of dissolved fermentable extract is converted by the yeast into ethanol and carbon dioxide. Therefore, a decreasing density therefore indicates progress of the fermentation process, while stable density indicates that the composition of the fermented beverage is changing just slowly.
Fermentation signals need context – e.g. the recipe, temperature, suspended solids, the location where the sample was taken and the basis on which it was measured. A constant density reading does not necessarily equal a complete fermentation – it is not a direct alcohol reading.
What Does Density Measurement Reveal During Fermentation?
Prior to fermentation, wort, fruit juice and other raw liquids hold abundant dissolved sugars and extractives, increasing liquid density. Throughout yeast fermentation, fermentable sugars transform into ethanol and carbon dioxide. Ethanol is less dense than water, with the generated carbon dioxide escaping the liquid. Thus density of the liquid under fermentation tends to decrease.
The shape of a trend is more important than a single reading. To illustrate this, consider the following example:
| Stage | Illustrative density | What the trend may suggest |
| Initial liquid | 1.050 | Fermentable extract is present |
| Active fermentation | 1.030 | Composition is changing |
| Later stage | 1.012 | The rate of change has slowed |
The density measurement for beverage production has to be checked against the respective beverage recipe and the established process data of the plant. Different sugars, non-fermentable solids, fruit and additives have different trajectories. The important question is whether the current curve corresponds to the expected status of the batch or not. This has to be checked against the process data of other batches of different formulations.
What Can Change a Fermentation Density Reading Besides Fermentation?
Temperature Effects on Density Readings
One of the biggest errors made when using density is relating the reading to a temperature. The density of a fluid changes as it expands or contracts with temperature, and most reference values are based on a fluid being tested at a specific temperature. This means that a reading taken ‘hot’ in a tank and a reading of the same sample after it has cooled will give different results for the same batch of material. By using a temperature-compensated density measurement, the reference temperature is visible.
Sampling and Measurement Conditions
Another important consideration for effective sampling is the measurement location. Gradients can exist in tanks with limited mixing but a pipe carries a moving average representative sample. This includes factors like gas bubbles, foam, suspended yeast, fruit particles etc. Also, the time of sampling is important. A cup filled at the time of highest gas release may not reflect the same fluid as an online signal that has stabilized.
Record the conditions against the value: Temperature, Sample/Sensor Location, Batch Stage, Unit/Scale, Liquid in Motion/Settled. Recording these minor details makes for a auditable trend and allows a production team to distinguish between a change in composition and a change in measurement of the liquid.
What Can Density Tell You About Alcohol Content and Fermentation Completion?
Estimating Alcohol Content From Density
Density does not directly indicate alcohol concentration. Alcohol can be estimated using density when initial and final readings, temperature basis and a beverage-specific validated calculation method are known. Liquids of similar density may vary in ethanol, dissolved extract, acid and other constituent proportions. An accurate alcohol percentage therefore requires a validated alcohol testing method.
Stable Density as Evidence of Fermentation Completion
A short plateau in fermentation can represent a number of things including a brief slowdown in yeast activity, an artifact of temperature, of mix, of measurement. A recipe made with unfermentable extract for example can reach a stable density and yet have more to do with fermentation.
Monitor density trend with approved plant release criteria. Compare with other sensory or laboratory results and process history for batch in question. Density is strong process signal for determining if batch is moving in correct direction. Be very cautious in transferring a threshold from one recipe or beverage category to another validate basis for change.
How Can Online Density Monitoring Support Batch Decisions?
Repeated readings of density measurements can be transformed into a time-based process record. This enables operators to compare current slope of the measurement of a batch with the slope of previous batches. In case of an unexpected pause in the production process, the effect of temperature or of other production events can be determined sooner. Quality personnel can check whether a single sample measurement is representative for the contents of the tank at the time of sampling by reviewing the trend.
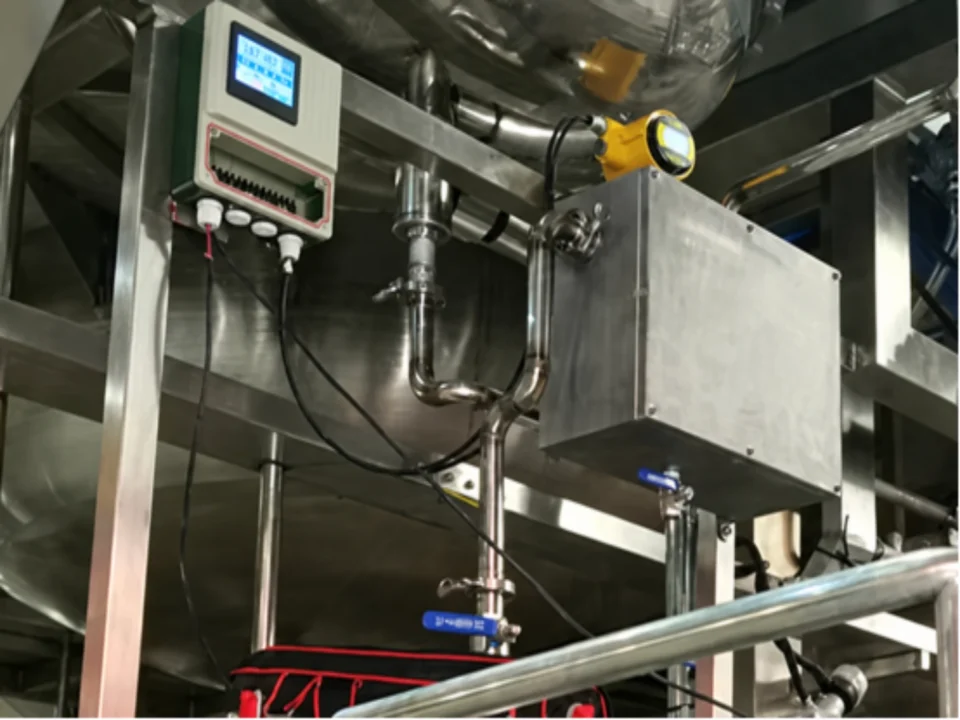
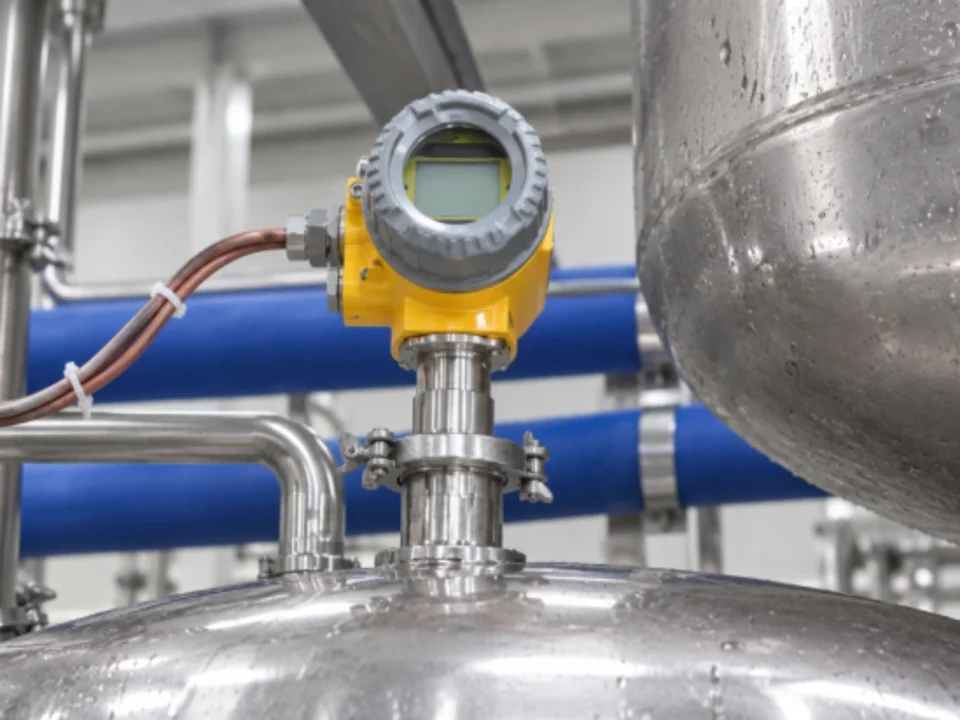
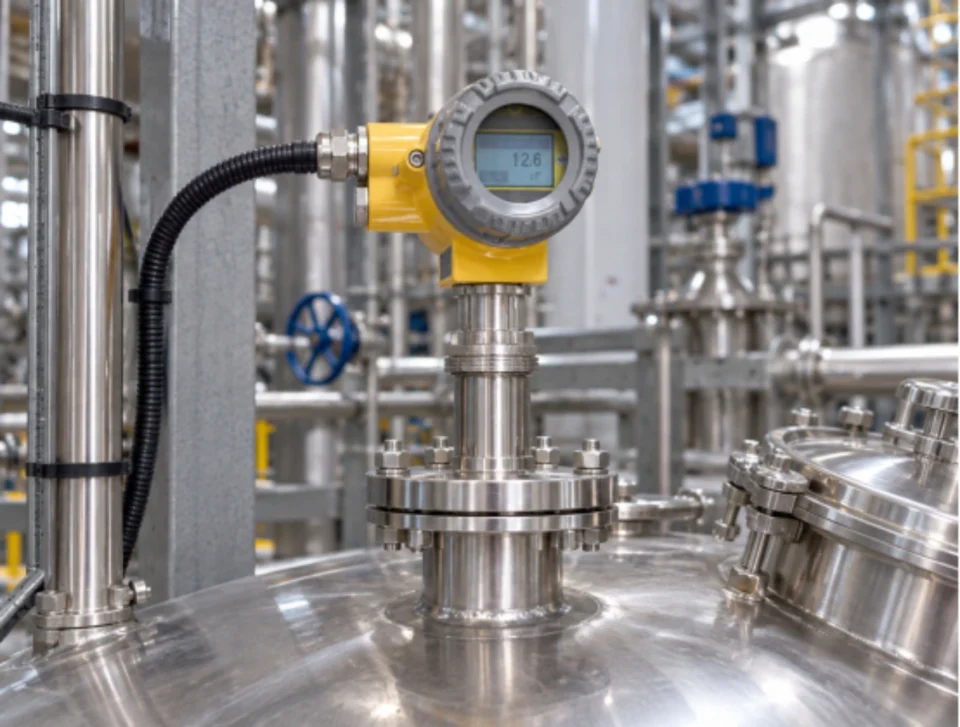
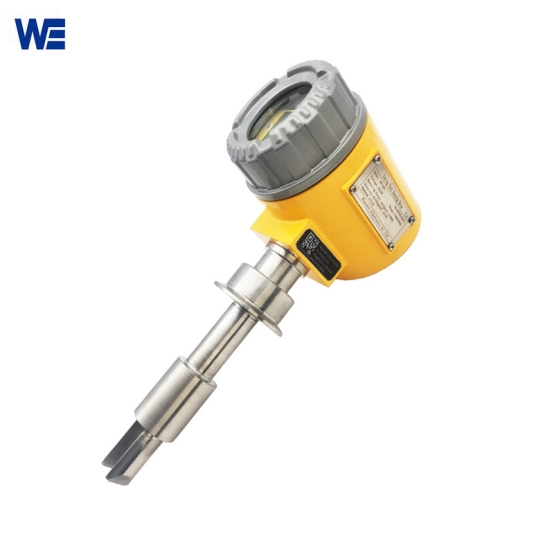
For teams considering a continuous signal, Wepower Electronic’s online vibration concentration meter is described for real-time monitoring in tanks, bypasses, and pipelines.
The value of an online signal is greatest when the signal trend is linked to a specific batch and to a constant measurement basis. In this way, an abnormal signal can be compared to normal behavior for that batch and a decision made as to whether or not to take a sample and have it sent to a laboratory for verification.
Discussing Fermentation Measurement Needs
If you are considering density measurement in your beverage production process, you can share your process conditions with Wepower Electronic so that the measurement discussion can begin with a clear application and comparable measurement benchmarks.
FAQ
Is Specific Gravity the Same As Density?
Density is measured in units like kg/m3, whereas Specific Gravity is a ratio of a liquid’s density to that of a reference material, so it has no units. Both measurements reflect the fermentation status. For subsequent data comparison, the reference temperature and measurement scale must be recorded.
How Often Should Density Be Checked During Fermentation?
There is no universal interval. The process team chooses a frequency that is sufficient to track changes in the process and allows for a decision for the next batch. A slow process with little chance of change may require fewer observations than a highly active process in the middle of a transition, and an online signal can provide a continuous trend for comparison.
Why Can a Sample Reading Differ from an Online Reading?
These two readings may be taken at different temperatures, locations, times, etc. Also, bubbles, foam, suspended solids, settling, etc. as well as sample handling can affect results. Check the measurement conditions before deciding that one of the instruments is not working correctly.
Does This Apply to Wine and Other Fermented Beverages?
Follow many fermentation processes by monitoring density trends. As with any measurement, interpretation is also influenced by the dissolved solids in the beverage, the recipe, the temperature at which the measurement was taken, yeast performance and other relevant, validated process parameters. Do not confuse rules for measurement of beer with those for wine, cider and spirits wash etc.